EPM Reports – Getting Started
This blog was just intended as a quick start guide to EPM Reports, but now it also has tips for extracting Cell Comments, Supporting Details and Cell Attachments. While compiling the notes, the feature to get the Cell Comments that users enter in Web Forms and Smart View provided a way of extracting all the Cell Comments from the model. In reality you’d need to focus the search as this is a report with suppressed rows and a calculated column to hold the text output, but it can give just the account/period/dimensions that the comment is on.
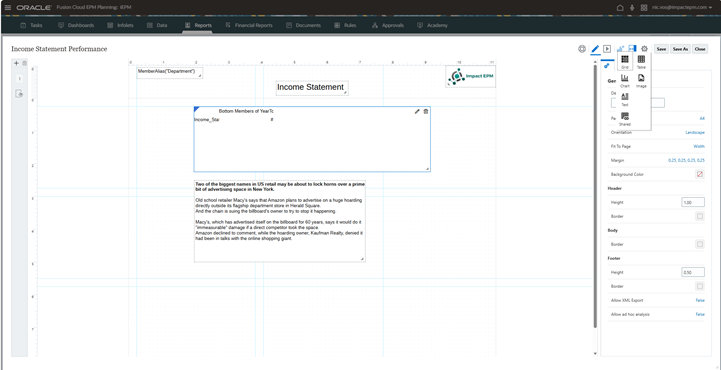
Basic Report
This is the basic canvas for creating reports with the object selector open. Select an object for it to appear on the grid and then drag it to size and place. The text has been added manually in this example at design time.
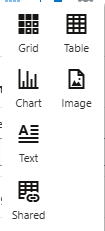
Object Selector.
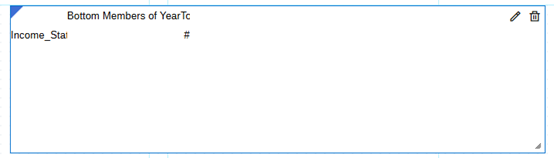
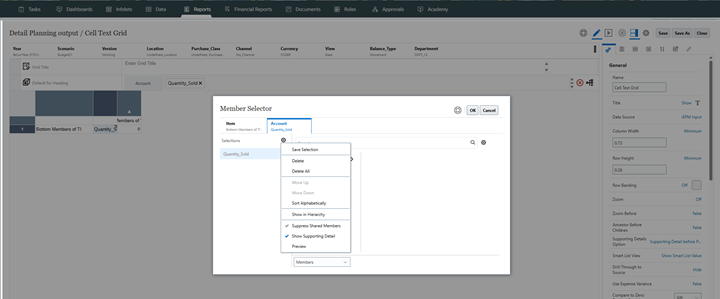
To set the grid dimension and member selections, click the pencil tool in the object or right click the blue triangle in the top left corner.
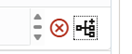
Dimension selector tool is the target button. Drag and drop the dimensions to rows and columns.

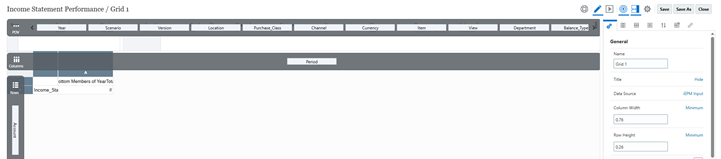
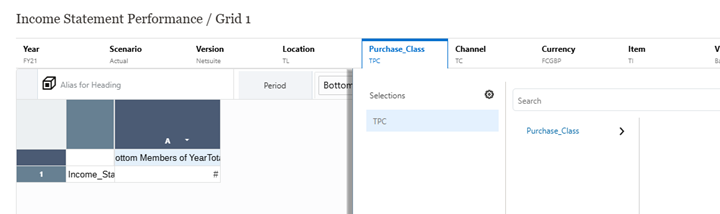
Member selection for page/POV members is slightly different to that of the Rows and Columns, here you click on the dimension tab.
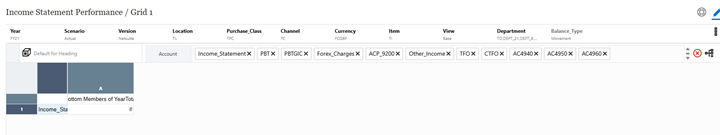
In Rows and Columns the member selector is the TREE button
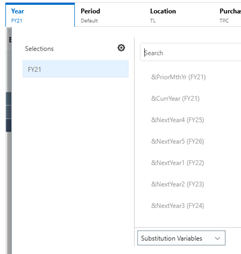
Selecting Substitution Variables can be done as well as members.
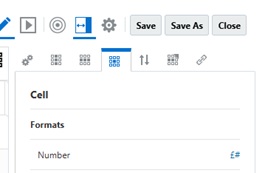
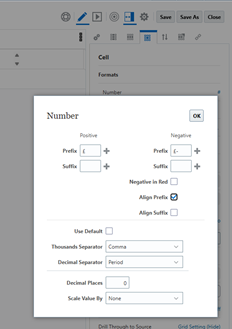
To set the cell number format, from the Cell settings, click on the # sign
Adding Calculations
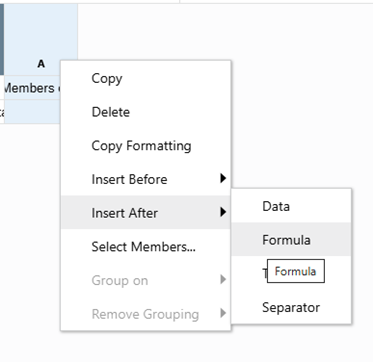
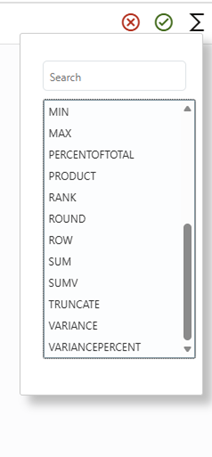
Columns and Rows can be added with formulas. E.g. Formula [a]-[b])/[b] or use a function VARIANCEPERCENT([a],[b]). Click the down arrow that appears when hovering above the column header to add the column.
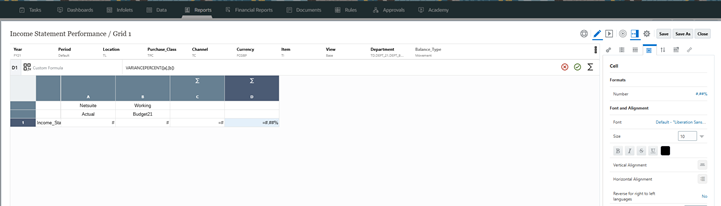
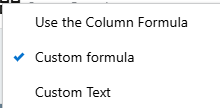
Make sure that the type of formula is set correctly
Click the green tick to validate and save the formula you enter.
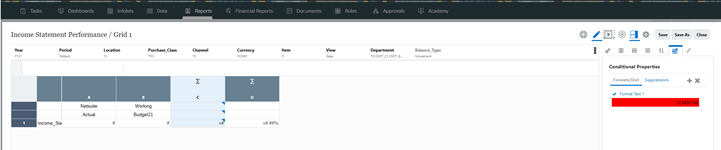
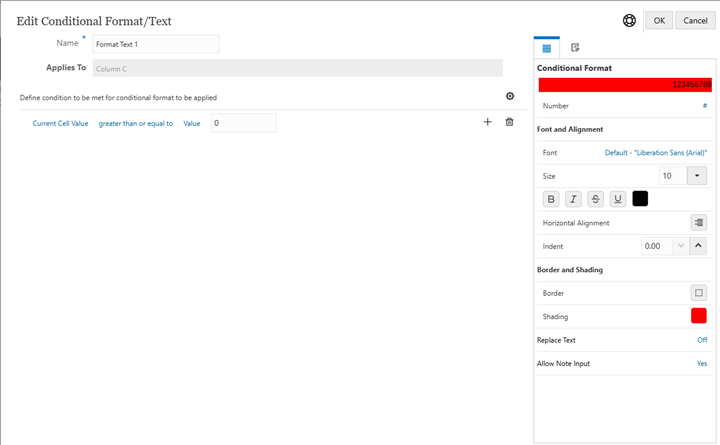
Variance Reporting
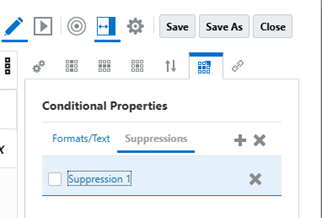
Conditional highlighting based on a formula. Add them under the “Conditional Properties”
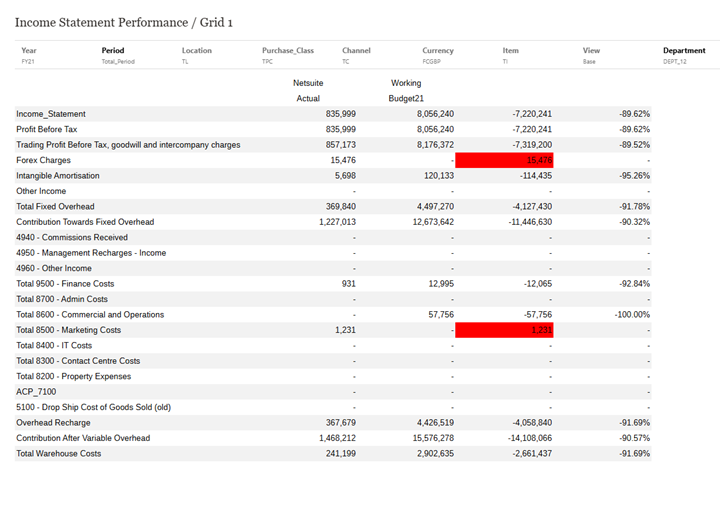
Add conditions and definitions by clicking on the blue highlighted text “Current Cell Value greater than or equal to value 0”. This varies depending on what you’ve chosen.
Charts
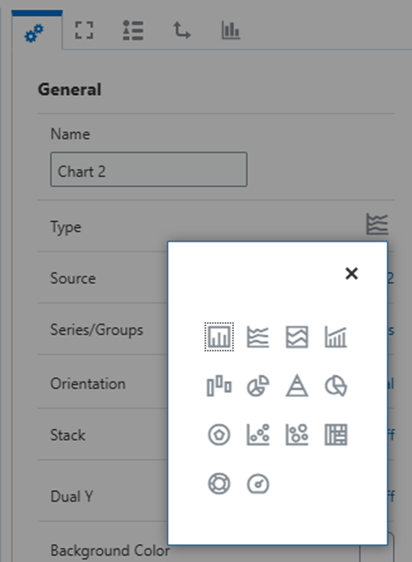
Charts can be added to a report from the object selector menu.


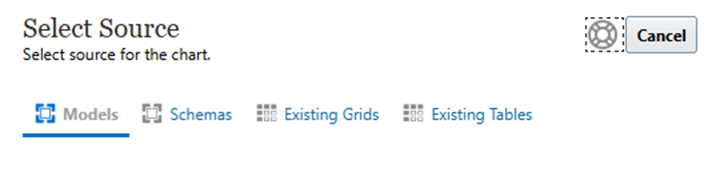
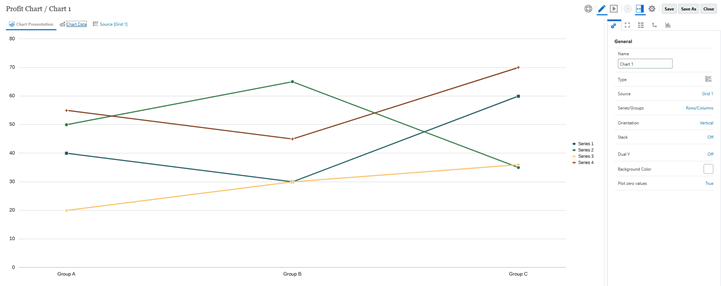
Chart types can be selected from the Chart Object General Settings
Define the data grid in the same way as for a report grid.
Extract Cell Comments
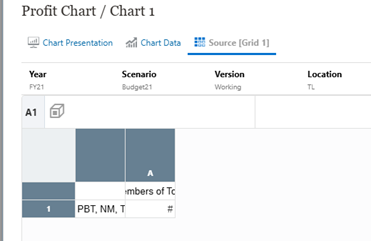
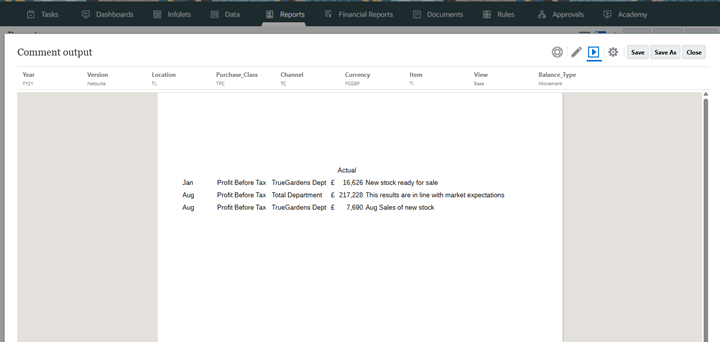
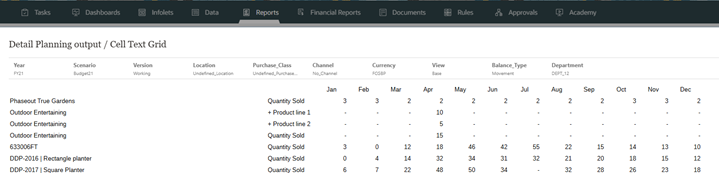
The example below shows a retrieve of all the comments input as “Cell Comment” at the POV (Point of View) being reported on.
It is a single grid using the CellText() function to get the value from the row being reported.
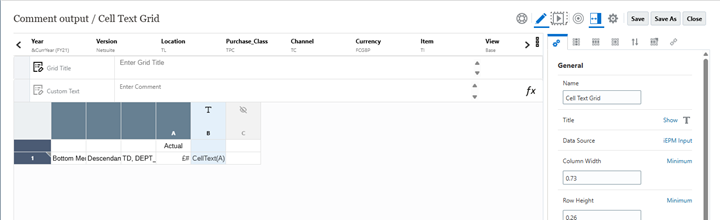
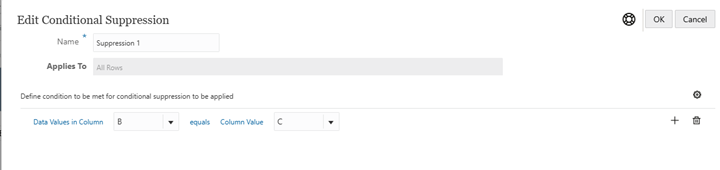
Column B has the cell formula. This report requires some suppression otherwise all the rows with data values would appear, all that is required is to show the numbers and context of the cells with text values.
Conditional suppression doesn’t work directly on the text columns, so an additional blank text column was created. Suppression can be applied when one column equals another to remove the rows without text.
Report Book
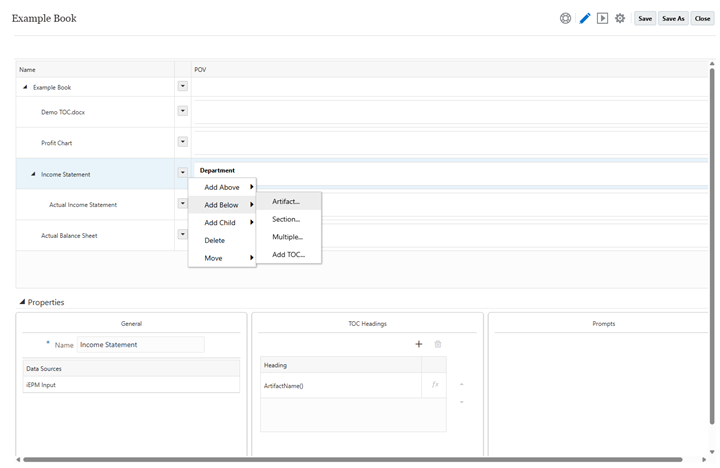
A report book is a compilation of separate reports that can have different points of view and be combined with a cover page and contents. Create a report book and start adding report artefacts.
In the book set the page headers & footers

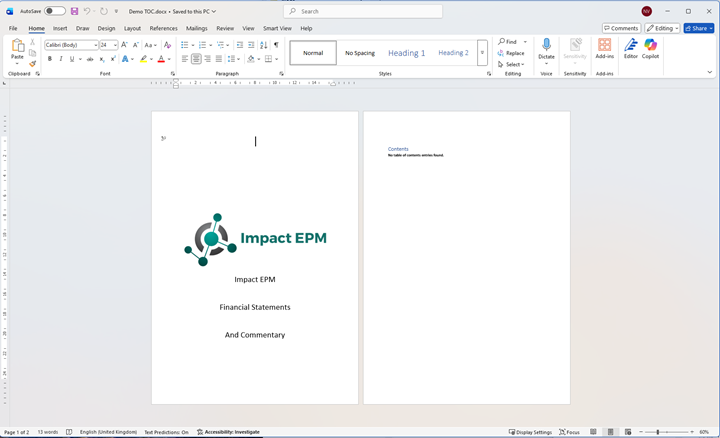
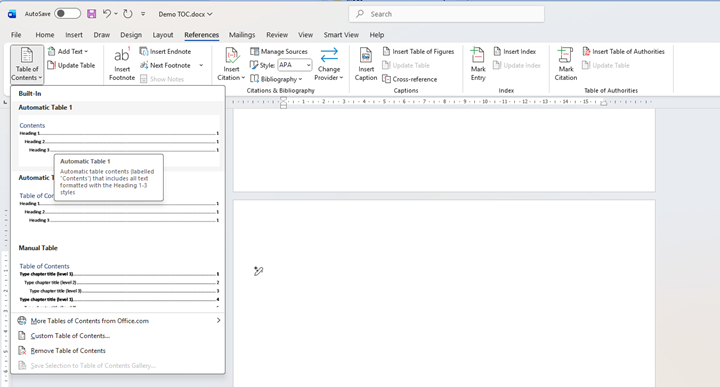
To create a cover page and a table of contents in the report book, set up the template in WORD and save as a “.Doc”. Upload the WORD document for the cover page and table of contents into the documents tab.
Example of cover page and shell table of contents in WORD.
Add a Table of Contents (TOC) on the page after the Cover page. The TOC will use any of the styles chosen from word, there do not need to be any entries in the WORD document for the TOC to reference.
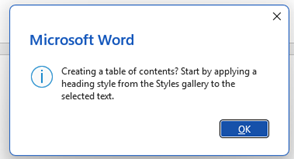
Message from WORD on applying styles, just ignore this
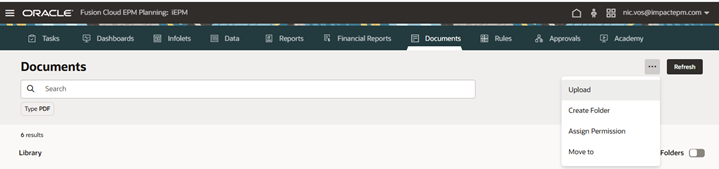
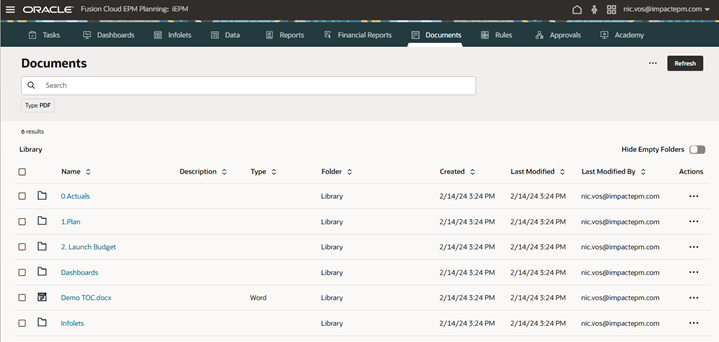
Upload the WORD document for the cover page and table of contents into the documents tab.
From here the TOC can be included into a Report Book.
In the Report Book definition “Add TOC” and select the WORD document. It normally goes to the bottom of the book, so it will be necessary to move it up.

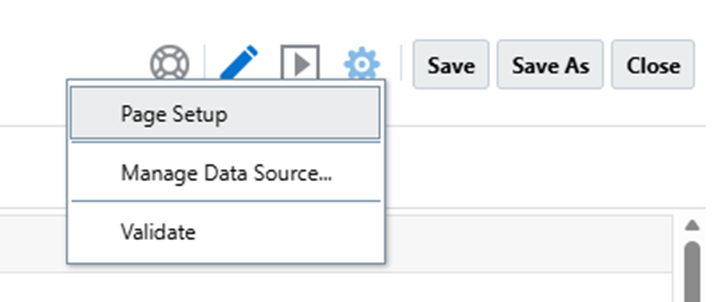
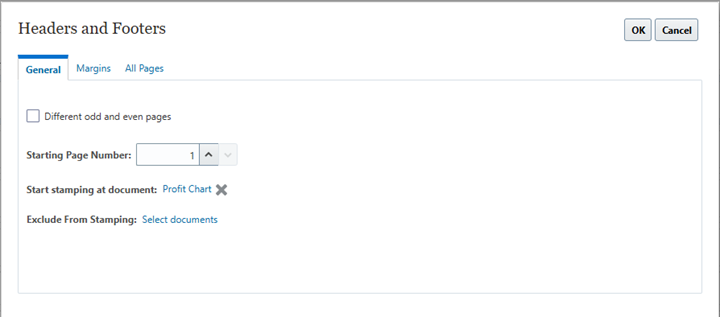
Through page setup set the starting page number and the report artefact to start it from.
Bursting Reports
- Bursting separate report pages to different users can be done with a book or a single report. The source artefact must have a dimension that is open for selection, in this case department.

To distribute different pages to different users set up a bursting definition file in CSV format to identify which recipients get which pages.
| member | user_names | group_names | external_emails | user_emails | group_emails |
| Dept_5 | Nic.Vos@impactepm.com | Nic.Vos@impactepm.com | Nic.Vos@impactepm.com | ||
| Dept_21 | nvos@aqwerty.com | nvos@aqwerty.com | nvos@aqwerty.com | ||
| Dept_19 | nvos@aqwerty.com | nvos@aqwerty.com | nvos@aqwerty.com |
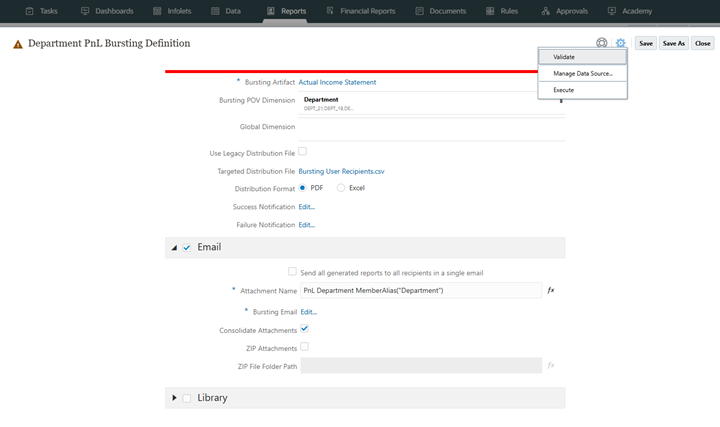
Then upload the file into the bursting definition and execute from the Bursting Definition Page.

Supporting Detail & Cell Attachments
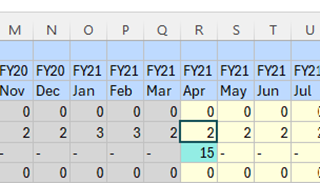
Supporting detail has been added to the account through Smart View.
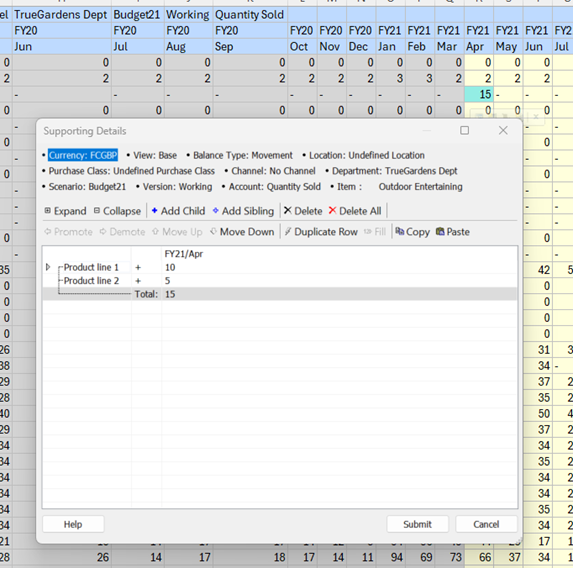
And a cell attachment into Apr.
Supporting detail lines in the report.
To enable the feature, in the member selector for Account dimension, check the “Show Supporting Detail” so that it is blue. By default, it is grey and not very clear.
To enable links to Cell Attachments enable the “Drill Through To Source” in the Grid Settings


The cell will have an underline on the value to open the link.
