What Breed of Essbase to choose – BSO – ASO – Hybrid
Imagine you are an Oracle EPM architect with a set of requirements, mulling over how to configure your Essbase cube. Aside from the dimensions another issue is whether to choose BSO, Hybrid or ASO storage.
Maybe you’re a project manager and want to kick the tyres of a Planning design to see if it’s about right, then this is the same question I’ve been musing over for some time.
In this blog I’ve tried to create a rule of thumb on how it should be. Of course selecting the wrong cube type and realising the mistake after some development effort, that would be as welcome as a rattle snake in a lucky dip. I’ve had the similar problem with adding or removing dimensions after starting but that’s another subject altogether. In this blog I’ve run through some scenarios to help give some clarity on making that choice, supported by performance statistics.
Back in 1992 when Essbase was launched choosing was easy, BSO was the only option but by 2004 there was the Aggregate Storage Option. It was a bit like when ITV was launched on British TV, suddenly that doubled the choice of channels from just BBC.
Still, even then it was clear cut as to how and when you should deploy BSO or ASO, the choice being BSO for complex calculations, or if you had a million member dimension to roll up, it had to be ASO, it was as black and white as that. Hybrid was quietly introduced to Essbase in 2014 and made it’s way into the EPM Planning module round about 2020. In addition to that, further muddying the waters, ASO gained the capability to have custom calculations in addition to the allocations, thus extending it’s reach into the Block calculation territory a little more.
I’m not going to blog on how Hybrid works that’s been done before, here is a good one by Jake Turrell:
http://turrellconsulting.com/blog/?p=556
So the question I want to get to the bottom of is when to use, BSO, ASO or Hybrid and why.
The Tests
The processes that I wanted to check out were loading data, some basic calculation and retrieving data:
- Load data file at leaf node level in native Essbase format
- Run simple currency conversion from GBP to EUR
- Smart View retrieve top level data & zoom in to leaf level Item (product)
- In Smart View, run the test report with 35 columns of period data with summaries & variances dynamically calculated
- Reduce report columns to only “Rolling 12 Months” summary, retrieve with 1 cross dimension dependency on dynamic calculation of rolling 12 months
- Same test as 5 but change “Rolling 12 Months” member from dynamic run time calculation to pre calculated data
Omitted from the testing was any aggregation in Hybrid or Materialized Views in ASO
Testing Platform
To get me going the test bed application used is a copy of one I built a few years ago for a customer that had a particularly problematic report to get to run. It had 35 columns including periods, rolling 3 and 12 months summations, Averages, year on year variances and percent variances and so on. Rows were about 3000 summary SKU level of products.
The background to this model is that it was BSO, built pre Hybrid on Cloud and started life with all the report columns as dynamically calculated members, later the rolling 3 & 12 months were done in a calculation script as the production scale report wouldn’t run. Eventually in production I got this report to run in about 15 mins, so seemed a good one to adopt as the test bed.
Here are the dry statistics that will give an idea of the size of the test bed application, by any yardstick it’s not massive, but big enough to give a view on the differences between the three models, BSO, ASO and Hybrid.
The dimensions that the tests will focus on here are Item, a list of products and the balance type, which has a lot of on the fly dynamically calculated members to produce:
- rolling 3 & 12 months
- year to date
- closing balance
- movement
- year on year variances
For the non consolidating dimensions the report selects a single member, but otherwise it is the top of the aggregation i.e. Total_Department.
| Members in Dim | Level 0 | |
| Account | 948 | 759 |
| Period | 32 | 14 |
| Balance_Type | 18 | 5 |
| Year | 15 | 14 |
| Scenario | 21 | 17 |
| Version | 23 | 18 |
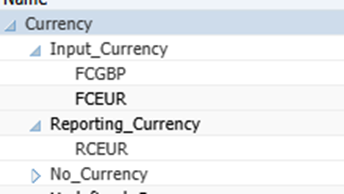
| Currency | 7 | 5 |
| Members in Dim | Level 0 | |
| View | 25 | 22 |
| Department | 28 | 27 |
| Purchase_Class | 26 | 16 |
| Location | 43 | 38 |
| Channel | 131 | 110 |
| Item (Products) | 18222 | 16979 |
| 13 Dimensions |
The model conversion was straight forwards, the environment had an ASO application, so all I had to do was just the addition of another BSO model and setting all the consolidation points to be dynamic calc, ensuring that the members were valid for both apps. Then checking all the ASO calculated members worked the same as the Hybrid versions.
What follows, you may already know or suspect, so these tests may only confirm your beliefs.
Test 1. Data Loading
So first up then was the data loads
The test data file zipped size was 38Mb, unzipped 687Mb
The load times are as follows:
| Time in Seconds | |||
| ASO | Hybrid | BSO | |
| Load native Essbase format data | 45 | 29 | 29 |
I’m reassured that the BSO and Hybrid are the same, which is expected as Oracle are telling us that at level 0 it is the same. The ASO was a bit longer, however on balance I see this as neutral factor.
I ran the aggregations on the BSO cube giving us something of a size big enough to work with.
| Size in MB | |||
| ASO | Hybrid | BSO | |
| Index File | n/a | 78 | 1,687 |
| Data File | 647 | 705 | 18,824 |
Test 2. Currency Conversion
For the next test I wrote a regular BSO calculation that would clear and reseed the converted data into the Reporting currency, and an ASO custom calculation to give the same results. I’ll do another blog on that as the performance was impressive to me at any rate.
Currency Dimension
| Time in Seconds | |||
| ASO | Hybrid | BSO | |
| Calculation | 31 | 41 | |
| Top Level Retrieve of currencies | 1 | 7 | |
n.b. I didn’t run it for block storage.
We will see in a later test, pre-calculating leaf level data is advantageous for the retrieves in both ASO and Hybrid. As you’d expect because it is not having to do a calculation on the fly. In this test there really isn’t much difference in the calculation time to say one way or the other ASO or Hybrid, however ASO in a straight roll up is easily the hands down winner in the retrieval.
Test 3. Smart View Retrieve
In the top level smart view retrieve I took “Income_Statement” in the account dimension and Totals from the other consolidating dimensions, followed by a level 0 zoom in on the Item dimension as below:
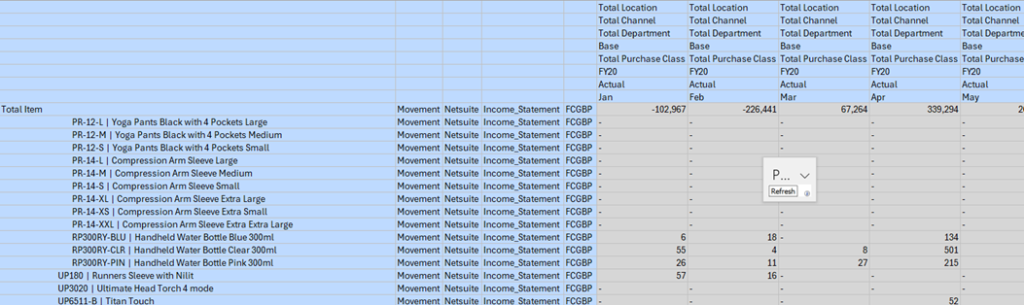
Image is truncated at a few Item members.
The timings are:
| Time in Seconds | |||
| ASO | Hybrid | BSO | |
| Aggregation of P&L data | n/a | n/a | 5400 |
| Top Level Retrieve | 2 | 5 | 2 |
| Level 0 zoom suppress missing | 4 | 10 | 10 |
| Refresh at level 0 | 18 | 8 | 7 |
I recall years ago using the old VBA API in Excel to produce a query call to Essbase, it basically ran the Essbase Report Writer behind the scenes. To zoom in was very much smaller query e.g. Descendants(“Member”) than if you had all the members on the sheet whereby the query would have hundreds of lines rather than one. Essbase processed the former much more efficiently. However something different is happening on Hybrid and BSO nowadays.
What we can also see is that the BSO retrieved much quicker than Hybrid at top level, unsurprising as the result was already calculated, but you have to spend 5400 seconds beforehand to halve top level retrieve time. The level 0 retrieve on BSO vs Hybrid is the same, however the BSO model was unfragmented on disk and I’d expect that it would degrade over time as the database was used and updated.
Test4. Smart View report with 35 columns
Now to try the test report that was a challenge to run on the original system that the test bed is derived from. It was 35 columns, 28 of which are dynamically calculated members and in some cases two pass calculations e.g “Rolling 3 Months” would sum the periods and “Gross Profit%” would calculate on the accounts, so a very resource hungry report at runtime and produced about 5000 rows in the test.
| Time in Seconds | |||
| ASO | Hybrid | BSO | |
| Retrieve | 4 | Failed, port error | 1 |
| Zoom in Level 0 | 1860 | 673 | |
The BSO having the precalculated blocks yields dividends on this complex report. The Hybrid failed to return any data, it just crashed after a long time. Therefore if you found yourself with a Hybrid cube like this, then far more pre-calculation would need to be done before the rollup.
Test 5. Rolling 12 Months Summary
Because of the failure, I created a small version of the report to isolate the bottle neck in test 4, having only five columns two of which are dynamically calculated on the fly “Rolling 12 Months” and “YoY 12 Month %” giving about 3500 rows.
| Time in Seconds | |||
| ASO | Hybrid | BSO | |
| Retrieve | 2 | 178 | 1 |
| Zoom in Level 0 | 32 | 422 | 15 |
I’ve added the formula for the two dynamically calculated members below. The “YoY 12 Month %” was a significant performance hit in Hybrid, due to it having to cross multiple dimensions, Year and implicitly Period.
Rolling 12 Months
IF(@ISDESC("Income_Statement") OR @ISDESC("Closing_Inventory_Value") OR @ISDESC("Stock_Load"))
  IF(@ISLEV("Period",0))
    IF(@ISMBR("TP12"))
      @SUMRANGE("Movement", "TP1":"TP12");
    ELSE
      @SUMRANGE("Movement"->@MEMBER(@PREVSIBLING(@CURRMBR("Year"))), @CURRMBR("Period"):"TP12") + @SUMRANGE("Movement","TP1":@CURRMBR("Period")) - @MEMBER(@CURRMBR("Period"))->"Movement"->@MEMBER(@PREVSIBLING(@CURRMBR("Year")));
      ENDIF
  ELSEIF(@ISLEV("Period",1))
     #Missing;
  ENDIF
ELSE
"  Closing_Balance";
ENDIF
YoY 12 Month %
IF(@ISLEV("Period",0))
  ("Rolling_12_Months"-@PRIOR("Rolling_12_Months",1,@Relative("Year",0))) / @PRIOR("Rolling_12_Months",1,@Relative("Year",0));
ELSEIF(@ISLEV("Period",1))
  #Missing;
ENDIF
This test now becomes a benchmark for the next test 6.
Test 6. As Test 5 but Pre calculated Summary
This small report is the same as test 5 but replacing the on the fly calculation for rolling 12 months with a pre-calculation of rolling 12 months data column.
| Time in Seconds | |||
| ASO | Hybrid | BSO | |
| Calculate Rolling 12 months column | 7500 | 14 | 1087 |
| Retrieve | 2 | 6 | 1 |
| Zoom in Level 0 | 11 | 12 | 11 |
| Zoom in all levels | 16 | 12 | 15 |
| Refresh | 18 | 8 | 10 |
Something odd happened in the calculation on the ASO cube that it took 7500 seconds. The script started as a copy of the Currency conversion, but rather than multiply out by a factor, it added 12 columns, so 12 times more data to access but 250 times longer to run. Anyway, again the purpose here is not to start optimisations I’ll come back to that later, I’ll just take the results as they present themselves.
All in All
These tests have been set up to put the aggregation engines through their paces on identical models and see where scripted calculations can help the aggregation.
As ever it’s not so simple, what to choose depends on your use case. I’d like to start from a position saying let’s use an ASO model, instant aggregated results how great is that, but once the formulas start to stack up it can quickly become quite unwieldy and, if the precedence of calculation needs to be manipulated then it can become hard to maintain.
In Planning of course, the default is to stand up a BSO with an ASO cube to leverage the best of both technologies, however, I start from the view that maintaining two data sets always carries even some risk of being out of sync, so to shoehorn it into one cube is my preferred option if the use case will allow it. Hybrid seems to drop right into this space.
So then why not just simply use a Hybrid. I once did a hybrid model that had 9 Million blocks per scenario/version with 6 aggregating dimensions, straight roll up retrieval started off OK but got slower as the data volumes increased during development. The business complexity demanded BSO calculation scripts so ASO not an option. The other constraint was that to run BSO aggregations would’ve taken too long for a day time update. Consequently some partial aggregation needed to be done losing a little of the benefit of Hybrid. Comparatively my test bed model has 1.5 million blocks and 5 aggregating dimensions, it aggregates fine, only presenting an issue with a lot of formula driven sparse dimension members.
In the 9 million block model, dimensions were all quite small but presented many aggregation points, the test bed model has one quite large dimension the others are quite small. Rolling up these large dimensions if the forte of ASO. So it would underpin that the shape of the model is a key factor in the performance.
Views on ASO
Good For
- Straight line retrieval performance is at least three times faster in ASO than Hybrid. This must be because ASO only has to pick up a smaller amount of data given it hasn’t got to get a whole block and then uncompress it in memory.
- ASO handled complex cross dimensional formula extremely well, e.g. Year on Year variance for rolling 12 months (See Test 5).
- Results are always current without materialized views.
- Pre-calculating data on non-accounts dimension members where ever possible rather than leaving it to a member formula e.g. Rolling 12 Months.
- Large Sparse datasets that have upwards of the region of 100,000 members in a single dimension[1].
Avoid
- Complex business logic calculations2.
- Use as a staging model for large extracts of summary data.
Views on Hybrid
Good For
- For simple calculations and complex business modelling.
- Results are always current without a partial aggregation on the Hybrid.
- Pre-calculate data on non-accounts in Hybrid where ever possible rather than leaving it to a member formula.
Avoid
- With extensive dynamically calculated members (formula not rollup), hybrid is not an option. In any case, having an excessive number of dynamic members cascade on sparse dimensions is contra to good design as any process that references that cell will continually be firing off that calculation chain.
- Further to the above point, do not use complex cross dimensional calculations on Hybrid in the same way that you can in ASO it can kill the retrieve, e.g. Year on Year variance for rolling 12 months.
Views on BSO
Good For
- Down stream processes require data, having that pre-calculated is the best option for extracts and reports.
- Calculations that have a dependency on aggregated numbers like an allocation, interim results can be more transparent.
- Dynamically calculated members on sparse dimensions that are often found in reports e.g. variances or period summations.
Avoid
- Due to the overhead in time and disk space that BSO requires to do an aggregation, it would naturally become the third choice for most applications.
- Large Sparse datasets that have upwards of the region of 100,000 members in a single dimension[1].
[1] This was not part of the testing but is generally accepted, included for completeness.